Database Performance Simplified
A general model (or guidelines to live by) that won’t solve all your problems, but will keep you from getting into trouble overly quickly.

I have been fortunate enough to work on a few high throughput applications (Words with Friends, GitHub.com, Gaug.es, etc.; hundreds to thousands of requests per second) in my life where a database was the bottleneck. I am far from an expert on any database, but I have a pretty good mental model for how to use databases in a way that gets the job done, assuming realistic expectations of hardware/networking.
Most of the database performance articles I have read involve hardware specs, configuration changes, or are too specific about a data set and access patterns to build an overall model to live by. I guess it is best said that they are really focused on a specific problem, which is good if you have that specific problem, but if you just want to learn in general, you have to gather together a lot of scraps.
My hope for this post is to provide a general model or guidelines to live by that won’t solve all your problems, but will keep you from getting into trouble overly quickly.
Balance
This is an overly simplistic model, but indulge me. Imagine you have 100 units of work and only 100. If you use all 100 for writes, writes are fast, but reads are painfully slow. If you use all 100 for reads, reads are fast, but writes are painfully slow.
The goal is to balance the appropriate number of units toward reads and writes where both are fast enough, but neither is perfect. It is worth noting that a plethora of web applications are read heavy, often to the tune of 95% reads (or more). GitHub.com is probably 97% reads.
If your application is 97% reads, does that mean you should be liberal with indexes and apply 97 of the 100 units towards reads? Definitely not. Balance. Use the appropriate number of indexes to get performance that is fast enough.
Fast Writes
Fast writes are easy™. Create a table and insert rows into it. Never update or delete rows. Do not add any indexes. Boom. Your writes will be pretty fast using whatever database you choose (at least as fast as that database can go on the hardware/network you provide). To go even faster, do bulk inserts on the client side when possible, so you don’t have network overhead for every insert.
If you want to then randomly read that data by any columns other than the primary key, good luck. With no indexes, you will end up with a lot of full table scans. The larger your table grows the slower your reads will become.
Beyond insert only (aka append only), your best bet for making writes fast is partitioning. The two ways I’ve done this are partitioning by function and/or by server.
By function means you split off a table (or tables) from the rest of your data onto its own server. This leaves you with database servers that perform a specific function (or feature).
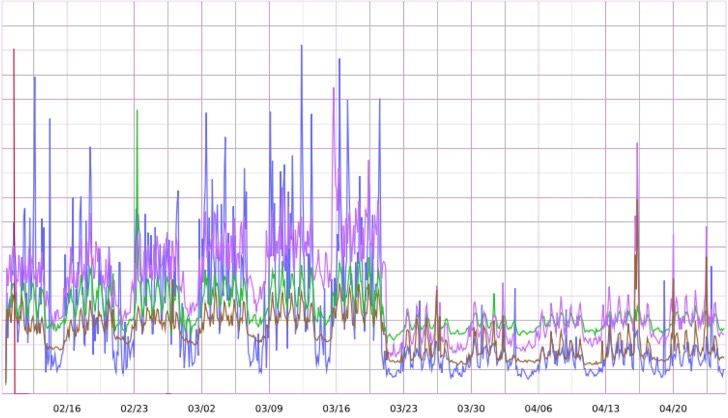
We actually do this for a few functions at GitHub — one being notifications and the other being dashboard event data (at the time of this writing). Both had throughput and storage requirements that were eating up all the resources on our primary database server, so we separated them onto their own server(s).
Below is a screenshot of SQL timing for notifications (as experienced from the app servers) around the time of the notifications move. As you can see, it is pretty obvious when we moved operations over to the new server.
Sticking with the 100 units of work idea, partitioning by function is like adding another 100 units, so you have 200. 100 go to your primary database server and 100 for notifications (or whatever function/feature you partition).
The next step up from partitioning by function is by server. Partitioning by server means that you split the writes of that table across many servers. I’ve seen this done using hashing (some id % # of servers), consistent hashing (ie: cassandra), and routing/lookup tables (GitHub’s git and pages infrastructure).
You can increase write performance by as much as you will probably ever need by partitioning by server, but you will also increase application complexity and operations. Another side effect is that reads across partitions will become slower (all the way up to impossible).
Fast Reads
Fast reads are a bit trickier. There are several solutions, but they basically all involve reducing the amount of data the database has to read to fulfill a query. Most of the ideas below can be used in combination as well, if necessary.
Add Indexes
The simplest way to improve reads is to add indexes, which most any database (even NoSQL) supports. When indexing, the goal is to get to a point where the queries you need to answer don’t have to sift through more than a few hundred or at most thousand rows. Ideally, the only data the database has to sift through is exactly the data you need to answer the query.
Let’s use GitHub’s Gist as an example. Each gist is owned by one user. This means we have a users table and we have a gists table with a user_id column. In order to show the most recent 50 of a user’s gists, we might do a query like so:
SELECT
  *
FROM
  gists
WHERE
  user_id = ?
ORDER BY
  created_at desc;
LIMIT
  0, 50
Without any indexes, the database will need to read the entire gists table to satisfy a query for an individual user. As more users create gists, each query for a user’s latest gists will get slower and slower.
The first step to make this query faster would be to index user_id. Doing so means that the database now only needs to hit the index to get all the gists for a user instead of the entire table. Additionally, the database will need to read the rows for those index entries, order them all by created_at desc (since we have the order by) and then discard anything after the first 50 (since we have the limit).
The problem with the user_id index is two fold. First, the more gists an individual user has, the more data the database will need to read and the slower the query will be. Second, databases can rarely only read a single row from disk. They typically work more with pages, which may hold 4-16k (bytes) of rows per page. This means that even though you only asked for user_id = 1, you are asking the database to actually read far more data than just for that user.
To fix the first problem with our index, we can do a composite index on user_id and created_at. In MySQL, that would look like this:
CREATE INDEX index_user_created ON gists (user_id, created_at);
I picture composite indexes like a nested hash, which is not exactly correct, but fits the bill for a usage/performance mental model.
index = {
  1 => {
    2015-09-8 00:00:00 => [1, 2, 3],
    2015-09-9 00:00:00 => [4, 5, 6],
    2015-09-10 00:00:00 => [7, 8, 9],
  },

  2 => {
    2015-09-10 00:00:00 => [10, 11, 12],
  },
  # etc, etc et
}
In the structure above, 1 and 2 would be user ids, the times would be sorted ascending and the values for a given user id and date would be rows in the gists table. Picturing a composite index like this is useful because composite indexes are only useful left to right.
If you need to query for all the gists of two users, this index will help. If you need to query for all the gists of a single user at a given time, this index will help. Additionally, if you need to query for all gists of a single user for a given time range or ordered by time, this will help. If you want to query for all gists (across all users) ordered by time, this will not help.
This means if you have a composite index on user_id and created_at, you do not need an index on user_id as the composite will cover you. Column order in composite indexes is important. As far as a rule of thumb, you should order by whatever will satisfy the most queries or when only dealing with similar queries, whatever will reduce the rows your database has to read.
Limit Everything
Lawyers always say "Never ask a question you don't know the answer to." Same for software. If you don't know limit, you don't know answer.— John Nunemaker (@jnunemaker) December 18, 2015
Always use a limit when reading data (and when writing for that matter). Even if the limit is higher than you ever expect, use a limit. Inevitably, someone will use your software in a way you did not expect. This use, in combination with a lack of limits, always causes slow reads.
Even better than an arbitrarily high limit is one based on actual data. If you are improving an existing app page, you can instrument a histogram of common result counts to help guide your decision on what would be a good limit (one that is rarely hit, but achieves performance goals)
A good example of limits can be found when viewing a large Pull Request on GitHub. At one time, it was assumed that everything related to a pull request could be shown on one page. The facts are there is a limit to a) what can be reasonably digested by a human on one page and b) how long said human will wait for a page to initially render.
Knowing these facts means that there is a “sweet spot” limit for how many events should be shown when initially rendering a pull request. Below is an example of what it looks like (at the time of this writing) when a pull request hits the limit. Because GitHub shows a mix of old and new events, the limit is actually shown in the middle of the page.

The pull request event limit for GitHub is hit very rarely. That said, having this limit means that pull requests still render quickly, even when there are a lot of events to show. Also, it doesn’t hinder users as the other events are only a few clicks away. The alternative to having a limit is pages timing out and showing an error, which is far worse than showing less data.
Denormalize
If indexes and limits are not enough to improve read performance, you can denormalize your data. Denormalizing is effectively trading increased read performance for more writes. This trade off works when the read to write ratio heavily favors reads, which is true for most web apps.
Continuing with examples from GitHub, let’s talk about stars. We try hard to avoid showing users spam. Spam state is stored at the user level as the user is either a spammer or not. In order to avoid showing spammy stargazers, stars were joined to users (SQL join) and stars from spammy users were filtered out (SQL where).
We had both indexes and limits, but reads were still slow. The downside of joining like this is that it requires re-computing spammy state for each star on each read. To improve reads, we added a new column to stars to denormalize the computation of a star being spammy, which allowed us to remove the join to users. Just to be safe, we ran some science in production and the results were as expected — denormalizing made reads a lot faster. Candidate is querying on the column added to stars and control is the join plus filter on spaminess.
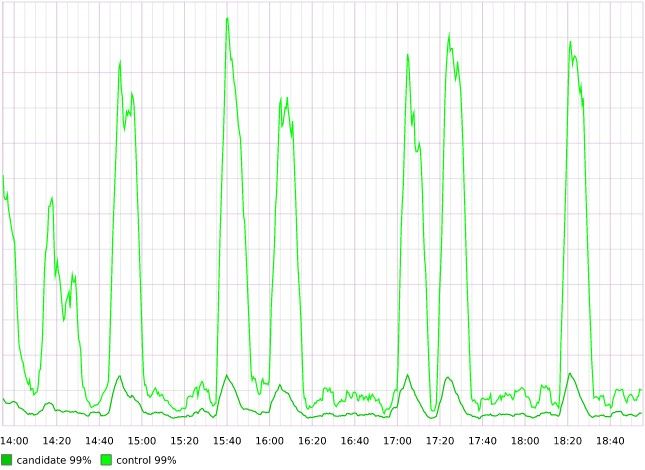
Because users are more likely to not be spammy and rarely do they flip back and forth between spammy and not spammy, the trade off of more writes (marking stars as spammy or not spammy when user is marked spammy or not spammy) to improve read performance was worth it.
Avoid One Large Bucket
Another form of denormalization is to group data into smaller buckets. For example, if recent data is more valuable than old, grouping data based on time might make sense.
A good example of this comes from gaug.es (which I originally worked on, but no longer do). I created new buckets for storing top content per month (ie: “content.2015.11”, “content.2015.12”). Most of the sites using gaug.es cared about the last month or two. Organizing content per month meant that, at most, the database would have to filter through the indexes/documents for the past month, rather than all content for all time, which would have been slow even with indexes.
Another example that comes to mind is Haystack, GitHub’s internal exception tracker. Exceptions are most valuable “right now”, when things are going wrong, so we have a pretty aggressive retention policy. We store needles in day buckets and only retain approximately thirty days (more or less depending on rate of exceptions during time frame) of data in the live system. It is worth noting that we do archive all data in an analytics system, if we really do need to go back that far in time, but, as you might expect, it takes far longer to read that data.
You can certainly bucket based on attributes other than time (user, account, etc.), but time can be a great one, especially when retention is involved.
Cache
Caching is the last option I would reach for when trying to improve read performance, but can definitely get the job done. The more you simplify the read model (key/value vs relational) and the more often you are reading from memory (as opposed to disk), the faster your reads will be. This is why memcached and redis are so fast. Caching is another form of denormalization, but you lose whatever transactional semantics the database you are using has. Complexity is the reason I would reach for caching last.
Conclusion
Writes are fastest when just appending (rows in a table, bytes in a file, etc.). To make them faster, partition them by function or by server. Reads can be made faster through indexing, limiting, denormalizing and caching. Read/write performance is all about tradeoffs and balance.
This post was certainly not all-inclusive, but it should help you get pretty far. Hope it wasn’t too generic and that the examples provided some concrete footing for each point. Let me know if you have suggestions for inclusion or any questions.