How to benchmark your ruby gem
We made a huge push to make Flipper more performant the past week or so (results at the end). It wasn’t that hard, but I realized I haven’t seen any articles like the one I’m about to write. Most of them are “here are all the tools” and/or “a single example” of how to use that tool.
What I felt they were missing was a general approach of how to take something and make it faster. So here goes nothing…
A Folder
First, create a folder in your project root (or wherever) named benchmark. I stole this idea from jekyll and grant you full permission to thusly steal it from me. The goal of benchmarks is to live on forever and allow others to use and learn from them, so get it in your version controlled history.
Some Tools
Next, you’ll need some tools – benchmark/ips, stackprof and @bkeepers. The last one is optional but highly recommended. 🤣 He’s friendly and encouraging (and you are going to need a companion on this road to performance glory).
You can just drop the first two tools in your Gemfile and bundle.
gem 'stackprof'
gem 'benchmark-ips'- benchmark-ips will tell you if you are making progress.
- stackprof will tell you what is impeding your progress.
Also, it’s worth noting that rbspy is really cool. I used it a bit on this, but found myself reaching for stackprof mostly out of familiarity (having used it in the past).
Some Scripts
Ok, so now you have a /benchmark folder and the tools you need, so let’s make your first scripts. For flipper, we knew we wanted to make Flipper.enabled? faster. So we started with enabled_ips.rb and enabled_profile.rb.
enabled_ips.rb
require 'bundler/setup'
require 'flipper'
require 'benchmark/ips'

actor = Flipper::Actor.new("User;1")

Benchmark.ips do |x|
  x.report("with actor") { Flipper.enabled?(:foo, actor) }
  x.report("without actor") { Flipper.enabled?(:foo) }
end
Not much to see here. We required the code needed and then setup a benchmark comparing the performance of checking with and without an actor. Next, we ran the script so we’d have an idea of where we were at.
   with actor    164.802k (± 0.6%) i/s -    832.116k in   5.049373s
without actor    259.654k (± 0.3%) i/s -      1.307M in   5.034628s
Note: you want to keep what’s inside the report block as tightly coupled to what you are trying to measure/improve as possible. Don’t add things like database queries or other heavy/unrelated operations as they’ll affect your results.
enabled_profile.rb
Now that we had a baseline, it was time to figure out what was slow. That’s where enabled_profile.rb and stackprof come in. Stackprof is a sampling call-stack profiler for Ruby.
That’s a fancy way of saying it samples what’s happening on an interval and shows you reports based on those samples. The assumption is the more times something shows up in the sample the more time it is taking.
require 'bundler/setup'
require 'flipper'
require 'stackprof'

flipper = Flipper.new(Flipper::Adapters::Memory.new)
feature = flipper.feature(:foo)
actor = Flipper::Actor.new("User;1")

profile = StackProf.run(mode: :wall, interval: 1_000) do
  2_000_000.times do
    feature.enabled?(actor)
  end
end

result = StackProf::Report.new(profile)
puts
result.print_text
puts "\n\n\n"
result.print_method(/Flipper::Feature#enabled?/)
For this script, I setup everything and then just called enabled? a bunch. Why did I choose 2M? Because it’s twice as nice. 😎
For real though, I started with 1M and it felt like it didn’t take quite long enough to run so I doubled it and it felt just right, like Goldilocks and the porridge.
First, we found that calling the method was faster than using the stupid #[] (now removed) method I made to check if a legit method and read an ivar. Iterations per second improved so we ran the profile script again.
Next, we found that the typecasting stuff I wrote was slow. We made a new typecasting_ips.rb script and followed our guts to a few speed improvements. Iterations per second for enabled? improved again so we ran the enabled profile script again.
Then we found that all the wrapping of actors we were doing was slow. So we yanked that junk out and iterations per second improved again. Back to the profile script.
I think you are starting to get the picture. Let the profile script guide you and use the iterations per second script to tell if you are making progress or not.
Measure, improve, repeat.
The Results
For us, the results were tremendous. We ended up with a directory of benchmark scripts as we kept pulling the string. Within a few hours, we’d improved the speed of:
enabled?with no actor by ~35%.enabled?with a single actor by ~50%.enabled?with 3 actors by ~250% and 5 actors by ~500%.get_allof 2,000 rows in the Active Record adapter by ~800%.
The neat thing is that before all this benchmarking, we didn’t even support checking multiple actors via enabled?. But after seeing the performance hit, we figured out how to make it work. Now, checking multiple actors at once is both a new feature and a performance improvement.
Best of all, it’s been well received.
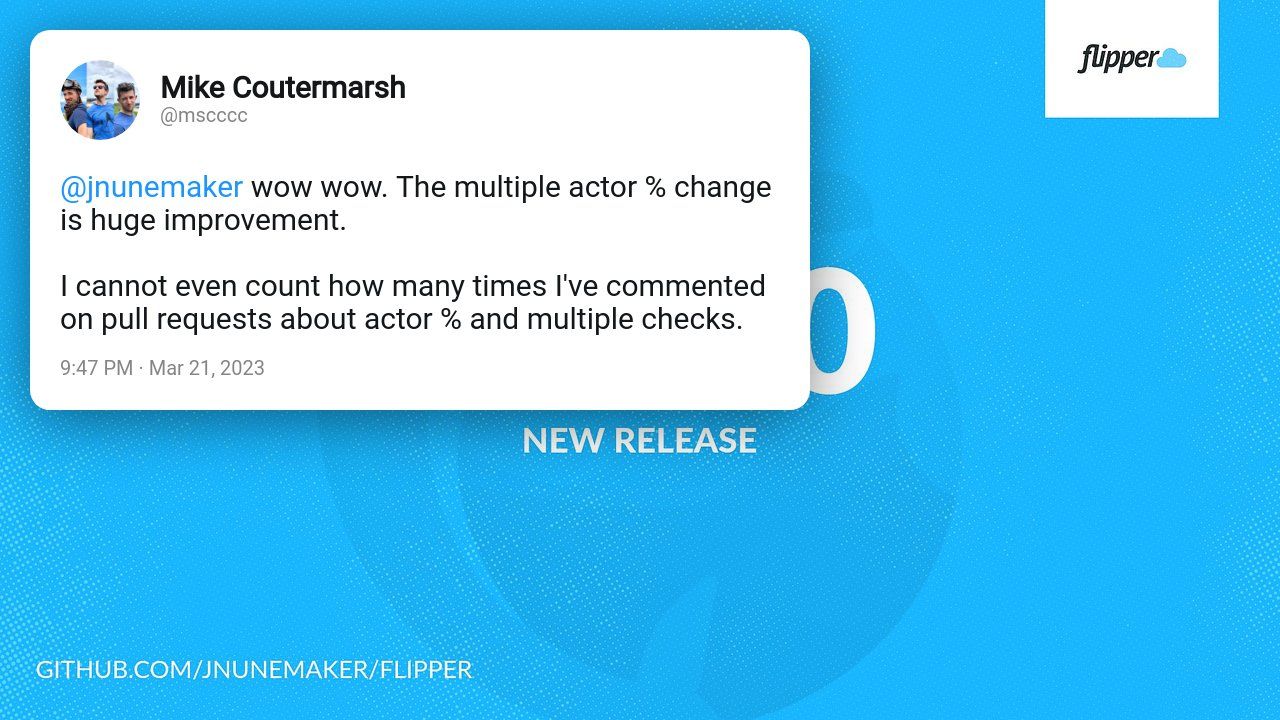
Important people welcomed the new addition.
That’s it! Hopefully this is helpful to you dear reader. Head on over to one of your gems, make a benchmark folder and start pulling the string to see what you can find.
P.S. if you are using flipper, be sure to upgrade to at least 0.28!
P.P.S. If you aren’t using flipper, hop on the feature flipping 🚂! It’s a fast ride. 😉